Hyundai IONIQ Forum banner

Drag Power vs Speed Chart

3 reading
15K views 12 replies 6 participants last post by  Jan Treur  
#1 · (Edited)
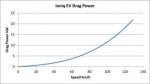
I have developed the attached chart showing total drag power (kW) vs speed (km/h) of the Ioniq EV.
The chart is based on EPA official publication of drag coefficients for the Ioniq EV.
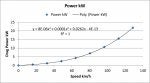
EPA is using coefficients to the function y=Cx^2+Bx+A where y is the total drag force (resistance) in lbf and x is the speed in mph.
The target coefficients for the Ioniq EV as found by EPA (or submitted to EPA by Hyundai) are: Coef A=21.17(lbf) Coef B=0.19016(lbf/mph) and Coef C=0.015762(lbf/mph^2).
 

Attachments

#3 ·
Shalom,
I assume this will be a similar drag curve for the HEV, although the front grille opening will make a difference relative to the blanked off front end of the EV. Weight difference when the vehicle is at steady speed should have less influence on energy
consumption?.
 
#5 ·
@coverman
I have made such study (for another forum) with the Prius PHV2 (Prius Prime in the US), Cd of 0.25 and slightly heavier vehicle, the curve for the Prius is only slightly above the one for the Ioniq EV, maybe 0.2-0.4 kW difference at all speeds.
The big factor (at high speeds) is the aerodynamic Cd.
 
#7 ·
Hi @fanda Welcome to the forum.
First, I think you have a mistake in the units you have used, I assume you meant kWh/100km i.e. energy required (or work done).
The chart is about what power needed at certain speed to overcome the resistance to movement including air resistance, rolling resistance etc. some call it "road load". The power consumed by the battery is something else as it includes losses by the motor, inverter/converter, transmission etc.
Imagine this: wheels are disconnected from the power train, motor is standing still. Car is towed by another car at a certain steady speed, the tow rope includes a dyno. showing the force needed. This force times the speed is the drag power the chart is dealing with.
 
#8 ·
This graph would be nicer with a finer grid. Otherwise, I like the axes... They use grams of fuel per hour on BSFC maps for ICEs, divide g/h by km/h and you get g/km. Here, if you divide the number on the vertical axis by the one on the horizontal axis, kW is kWh per hour, you get kWh/km: mileage...
 
#9 ·
@migle
Instead of finer grid (for better readability?) I am enclosing the function I used converted to kW vs km/h, so every value can be calculated and extrapolation to higher speeds can be made.

Image
 

Attachments

#11 · (Edited)
I don't think so. Your 5.1 miles/kWh is 8.2 km/kWh which is around 12 kWh/100 km. If you drive one hour at 100 km/h you use 12 kWh in that hour, which is an average power of 12 kW during that hour. And that is exactly what the graph indicates.
 
  • Like
Reactions: giora and IonicEV
#12 · (Edited)
It seems the figures in graph makes sense, but when I plugin mph into the original formula: y=Cx^2+Bx+A

Lets use 65 mph: y=0.015762*65^2 + 0.19016*65 + 21.17 = 100.125 lbf

Coef A=21.17(lbf) Coef B=0.19016(lbf/mph) and Coef C=0.015762(lbf/mph^2).

1.37W = 1 lbf/s.

What is the formula used to convert lbf into W ?
 
#13 ·
The coefficients of the formula are only applicable for x in km/h, so you have to multiply the 65 mph by 1.609 to get km/h: 105 km/h. That number can be used in the formula.