Hyundai IONIQ Forum banner

Setting up Torque to show BMS data on the Ioniq EV

96K views 83 replies 28 participants last post by  marcaccioc  
#1 · (Edited)
-
Here's some links on how to set up Torque to work with the S oul EV. (It also works on the Hyundai Ioniq Electric).
It would be really great if someone could create one of these help pages specifically for the Ioniq.
And report back on how these codes are working. Preferably on one of the other sites because I visit this site infrequently.

The original web page and discussion for these codes is on this forum - Setting up Torque to show BMS data
The main repository for the codes has since moved to github - https://github.com/JejuSoul/OBD-PIDs-for-HKMC-EVs
There is help in English here - Setting up Torque Pro to show OBD data on Hyundai / Kia Electric Vehicles
There is help in French here - Kia SOUL EV : comment lire les différents capteurs via OBD-II
There is help in French here - [Diagnostique OBD2] Torque Pro -Android- et le Kia Soul EV.
There is help in Korean here - 토크프로 중급편 (TORQUE) 확장PID 관리 하기

-----------------------------------

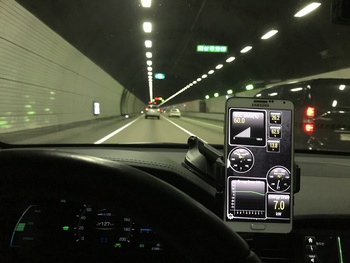
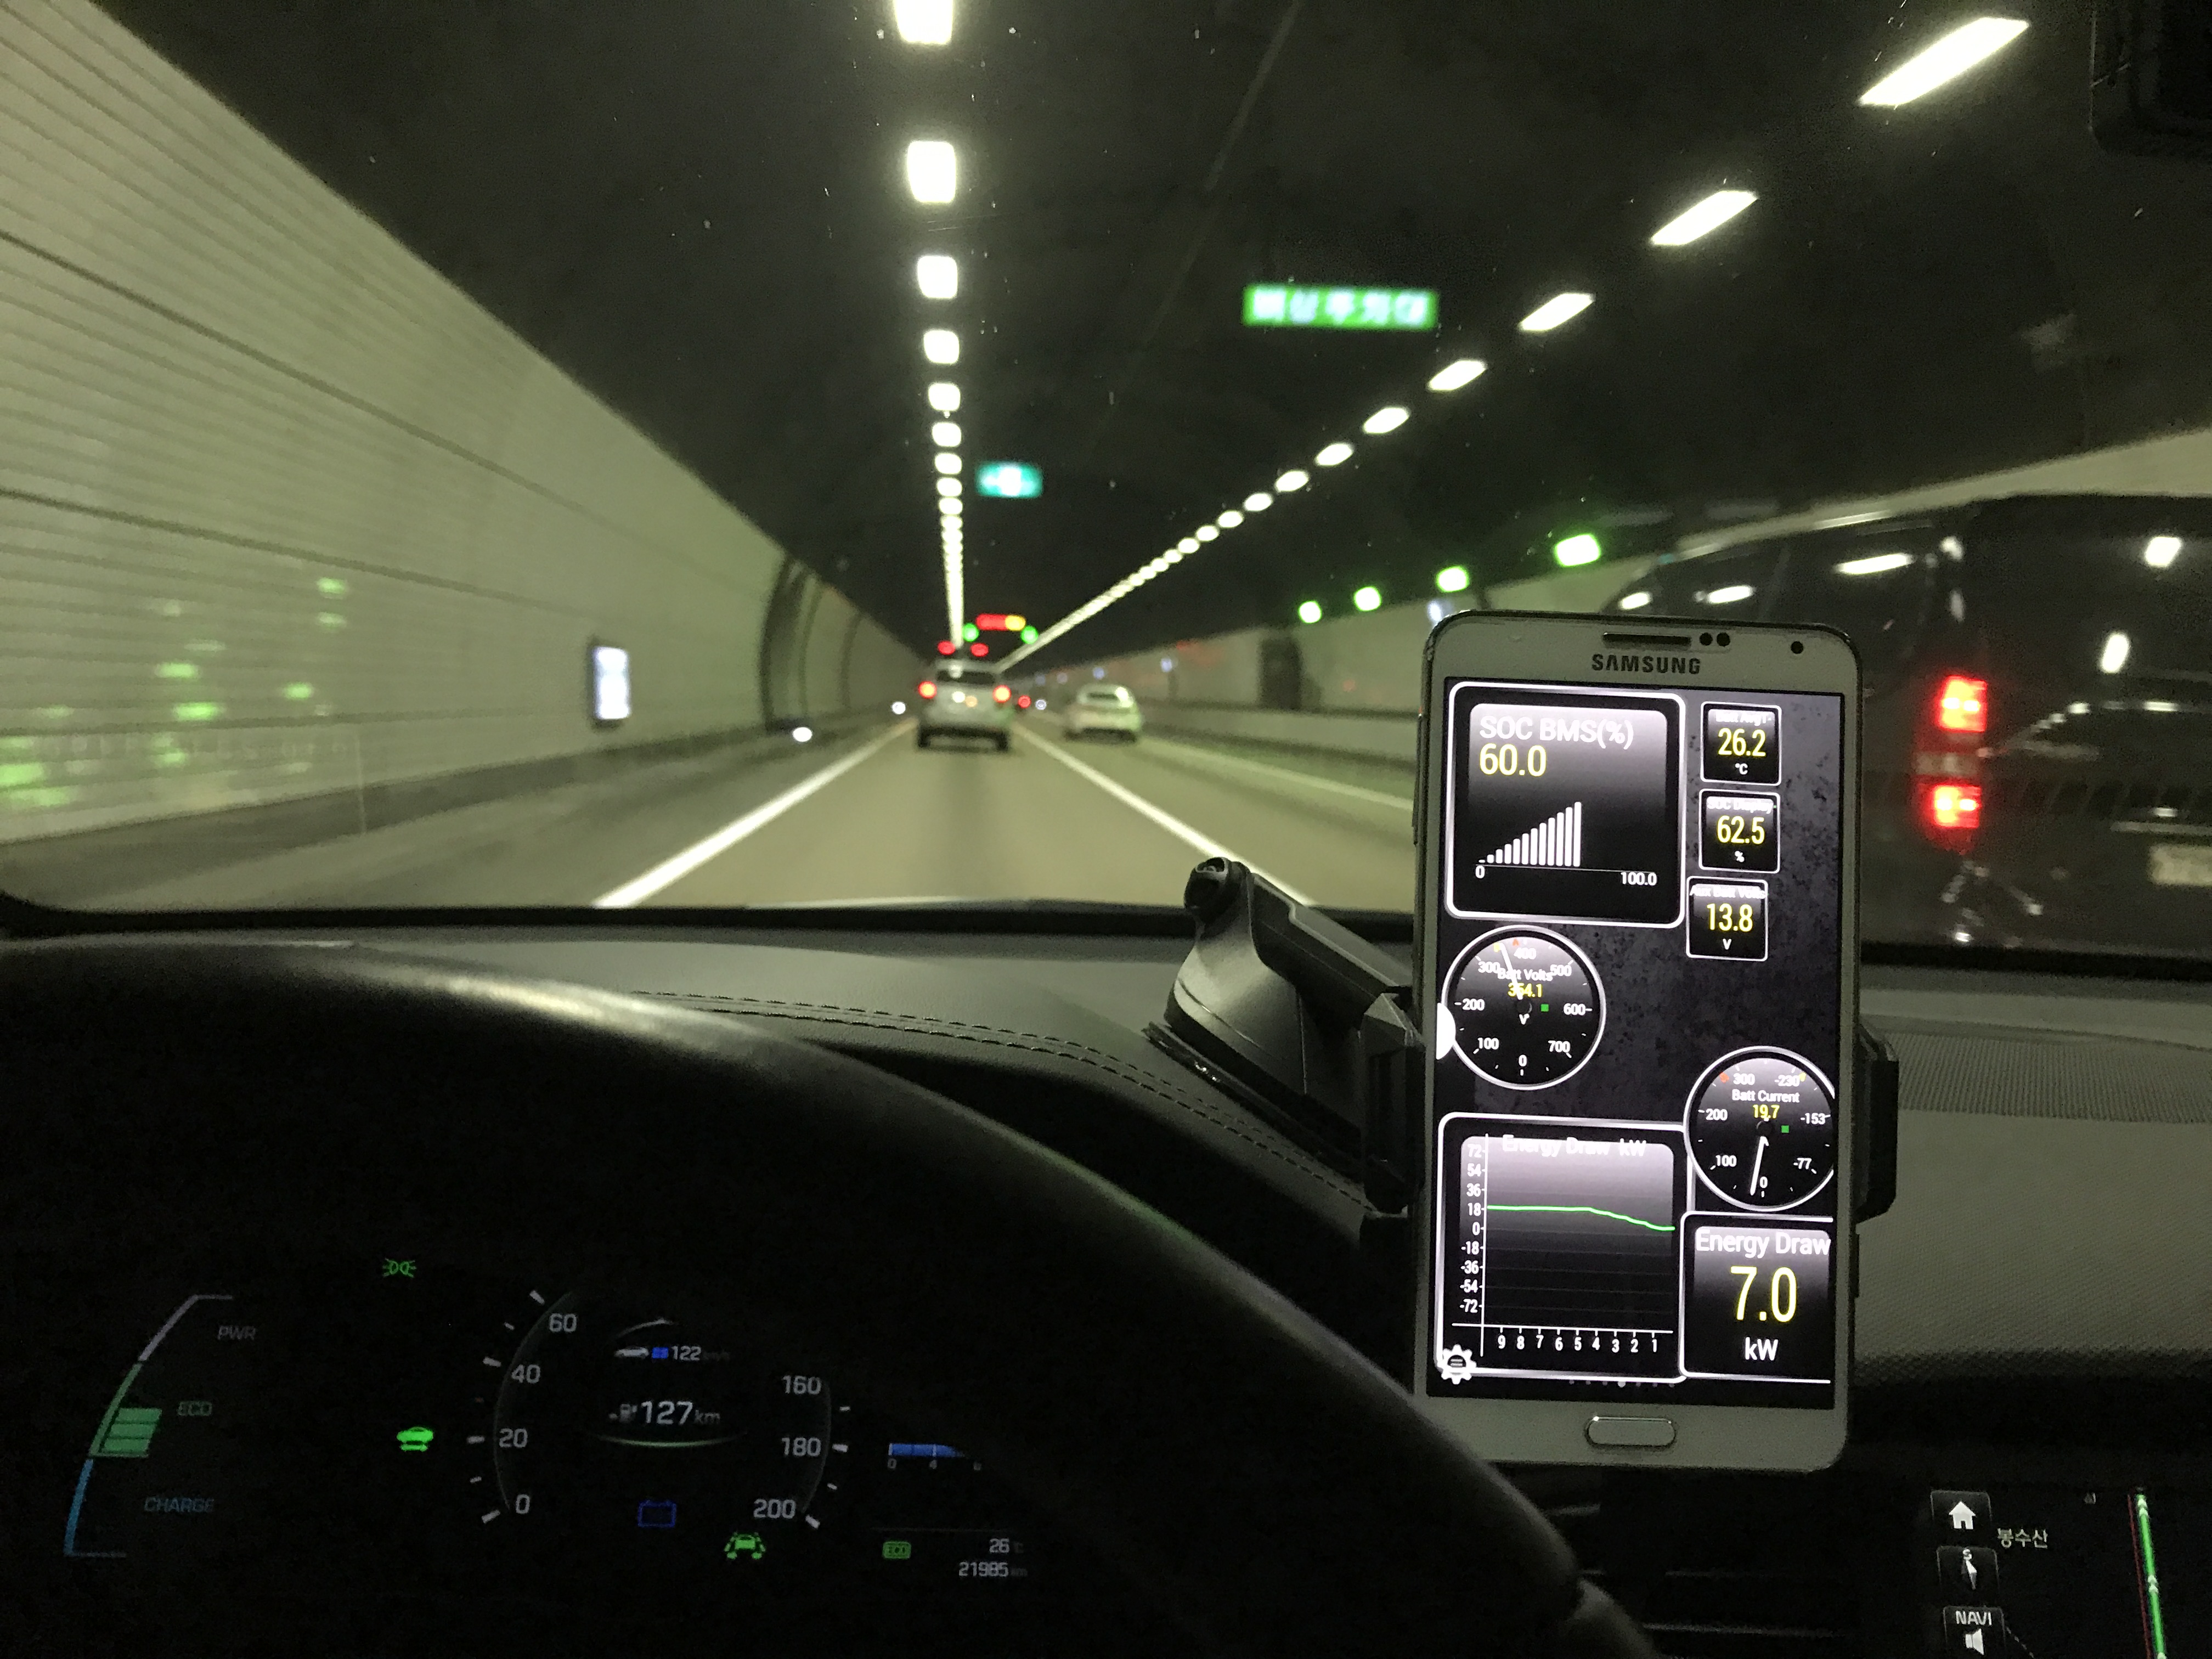
Here's Torque running on an Ioniq Electric in Korea.


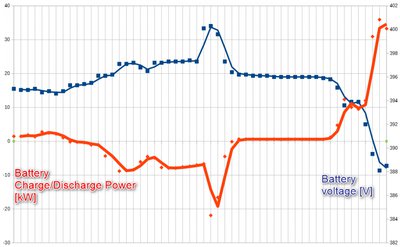
Nice graphic from German Ioniq user. Car starts at 100% SOC on top of small hill. Recuperates on the way down. and increases the batteries voltage.

 
#2 ·
I have been struggling with my OBD2 adapter to get it recording the Kia Soul PID parameters. No succes.To my surprise the ECU delivers only 5 standard parameters to the adapter. None if them is related to the BMS of my hybrid Ioniq. After reading some reviews on the Kia forum I learned that there is a lot of cheap crapware in clone OBD2 adapters. These clones have instable connections, are non full OBD2 compliant , very slow and not sensitive for non-CanBus parameters which seem to be relevant in hybrids. Thus very likely my adapter is junk, given the very cheap price. Pity. Im now heading for a OBDlink LX adapter, as recommended on this KIA forum. Price 89 euro, expensive but I trust the best choice at present.The Kia Soul is an EV. As far as I can see no one yet has evermade Torque logs for the Ioniq hybrid. So I feel as the first Trekkie astronaut heading for Mars.What will I encounter and can I ever get back?
 
  • Like
Reactions: Stevenke
#3 ·
Good luck using these codes on the Ioniq Hybrid. Please report back.

-------------------------

Meanwhile from Germany.
Overload the Hyundai I oniq Electric to a virtual "101%" battery SOC through regenerative braking.

Since I'm living on a small mountain I was wondering what will happen if I charge my Ioniq to 100% and regenerate more energy by driving down the mountain. As you can see it's possible to regenerate energy even if the battery shows 100%. In my case it gained energy up to 96% BMS (battery management system), which is the equivalent to 101% SOC (state of charge — what your Ioniq displays on its screen). Of course your Ioniq still shows only 100% maximum even when it's overloaded!

I used the app "Torque Pro" and the Torque plugin "Track Recorder" to record my ride.
You'll also need a bluetooth OBD2 dongle to connect your smartphone to the Ioniq to gain all the data.
 
#4 ·
Do I understand from this that 100% SOC on the car's display in principle means 95% charge of the total battery capacity? What about 0% SOC, does that correspond to 5% charge of the total capacity? Then the usable part of the battery is 90% of the total capacity. Or does 0% SOC correspond to 0% of the total capacity? Then the usable part would be 95% of the total capacity.
 
#6 ·
Based various rumours and speculations on the internet, I have heard that the 28kWh battery rating claimed by Hyundai is only 80% of the real battery size. I have no idea whether it is true, but this will mask any battery deteriorations over time, hence makes the lifetime battery warranty in CA feasible.

Assuming this is correct, then battery size is 35kWh, which makes it possible to overcharge above the stated 100% SOC.
 
#7 ·
Another "rumor" is that 90% is usable and total capacity is 31 kWh. I hope this issue can be settled once and for all by these Torque readings.
 
#12 ·
SOC BMS does not relate to the total capacity. It is another way to measure existing usable capacity. It will always vary between 2% and 95%. Hence it cannot be used to measure either deterioration or total capacity. If someone can show me I'm wrong I'd be pleased. It would be nice to finally have an answer to the question - what is the total capacity?
 
#11 ·
Pmiddeld, so you have no 5 = the obdlink LX? How are you counting , from 1 to 7 or downward from 7 to 1
 
#15 ·
Aha, I see youve replaced your first instance junk adapter too. A lot of crap is on the market. Check first on the Kia forum
 
#17 ·
Depends if we can define PIDs or identify sensors for it. Currently the cumulative amount of recharged energy is logged by using the KIA Soul EV PIDs written by Jejusoul. Regen braking energy is not identified so far. He is still working on improvement and conversion for the Hybrid. I support him by creating testlogs on my Premium SE. We'll have to give it some time.
 
#19 ·
Here's a new PID that I would like someone to check.

Can someone in a country that uses km/h for speeds confirm that this equation gives a result in miles/hour, not km/h.

003_VMCU Real Vehicle Speed,Real Speed,2101,((o<8)+n)/100,0,180,km/h,7E2
 
#22 ·
Also, maybe others could be interested, I created a calculated pid to give the time to charge to 45kW for 80%. Car gives for 100%


004_CALC Estimated time 45kW 80% Charge,45kW 80%C,2105,(MAX(0:28*(0.8-(af/200)))/45)*60,0,100,minutes,7E4
 
#23 ·
Thanks for testing this.
I just graphed some data from a car in Spain comparing GPS speed and the value for real speed from Torque.
Apart from a few glitches in the Torque data they are identical.


It confirms:
1/ The formula is mph
2/ The value for real speed exactly matches GPS speed.
3/ At one point the speed goes from zero to 655km implying the formula is signed. 1mph in reverse is displayed as -1

The updated formula is : Can you confirm it works.
003_VMCU Real Vehicle Speed,Real Speed,2101,((Signed(O)*256)+N)/100,0,180,mph,7E2
As long as your unit settings in Torque are set to show metric units the this will be converted to km/h automatically.


reald: thanks for that new formula. I can add to the extra gauges file
 
#26 ·
I just graphed some data from a car in Spain comparing GPS speed and the value for real speed from Torque.
No, that time I was in Portugal. Only the temperature log was from Spain.

I multiplied the formula by 1.609 to get km/h
If Torque does it automatically for us, it seems more terse to leave that responsability to it.

and compared to GPS speed which then was slightly lower (about 2%)
I then added a 0.98 multiplication and then the two speed indicators matched perfect.
What could be the reason for this 2% mismatch?
I also found that, only eyeballing the numbers. Did you actually do averages over a longer period?


I have one that's based on a 5 minutes average consumption and one of 15 min avg consumption. I have made them as distance to the turtle. I will now change to use the real speed instead.
But that's just a start for testing, I don't know if 5 and 15 minutes averages are the most useful.

My reason for doing this is that I have no idea how that is calculated by the car. If the battery is running low and I have to save energy I don't now if a change in driving style and speed is enough to get to my destination.
I agree with you entirely. We need a short-term estimate. But we also need to eliminate the height factor. Because, on a motorway, we never perceive well if we are climbing or descending...
We could remove it at least partially using GPS height (because we assume we won't be climbing the entire trip). Or, we could use accelerometer data and then also remove the acceleration.

Afterwards, I may ask what it was all about :)
Well, we have been reading and logging BMS data from the OBD port for a while now. JejuSoul is now looking again at data from another electronic control unit in the car (VMCU, vehicle management control unit) which has gears, speed as we now know, motor temperature, and more we don't know yet.

We have to supply him data, because he only has a Kia Soul EV.

Also on the horizon is the OBC (on-board charger). There is also discussion going on on JejuSoul's github, on the issues section. Many have the same nick there as they have here.
 
#24 ·
  • Like
Reactions: pmiddeld and chui
#25 · (Edited)
Hi again JejuSoul
I multiplied the formula by 1.609 to get km/h and compared to GPS speed which then was slightly lower (about 2%)
I then added a 0.98 multiplication and then the two speed indicators matched perfect.
What could be the reason for this 2% mismatch?
I use a Nexus 7 in the car now. I'll compare with the GPS speed in my phone, Samsung S7, and see if there is a difference.

It's great that we now have a real speed from the Ioniq. I have used the GPS speed so far for calculating my own consumption and available distance values.
I have one that's based on a 5 minutes average consumption and one of 15 min avg consumption. I have made them as distance to the turtle. I will now change to use the real speed instead.
But that's just a start for testing, I don't know if 5 and 15 minutes averages are the most useful.

My reason for doing this is that I have no idea how that is calculated by the car. If the battery is running low and I have to save energy I don't now if a change in driving style and speed is enough to get to my destination.
The first test using the 5 and 15 min averages was a success. I had to slow down a bit to get home (mainly due to a strong head wind) and stopped at home with 6% SOC.

This is what my main display in Torque looks like for the moment.
 

Attachments

#28 ·
migle:
I haven't made an average of the two speeds yet, I will do that next week.
The strange thing with the 1.609 scaling is that I first added that PID manually into Torque. Later I made some more changes and imported my CVS-file again and then I had to remove the 1.609 to get the value in km/h. So Torque is doing the scaling, don't know why it didn't from start.
I haven't really thought of including height, maybe I will do some thinking and experiments with that.
 
#32 ·
Yes, sometimes it stays on and drains the 12V battery a bit. It's not as much of a problem as in a normal car, because the car periodically wakes up and checks the level of the 12V battery and fills it up again. It is even less of a problem if, being in North America, you already have the newer Li-Ion 12V battery. However...

Some people use an extension which has a switch.

Another consequence, because most of these devices have no security, anyone can pair their phone and communicate. It's doubtful that someone can do anything harmful. But we are only beginning to discover what we can read from the OBD port, someone else might be researching a different path.

Also, if you go for the expensive OBDLink LX, which is faster than other dongles because it uses Bluetooth 3.0HS, the phone app, Torque Pro, has specific features to put it in low power sleep mode and wake it up. It is also only possible to pair with this device by pressing a physical button. I'm considering that it might be worth the price (because the price lowered recently on www.scantool.net).
 
#36 ·
Here is some readings I took on slightly discharged battery:

BMS SOC: 89.5%
Cell Voltage: 4.04V

It is known Li-Ion cell max voltage is 4.2V at 100%. So at least SOC and voltage do not match with SOC higher than voltage suggests. Have to dig more info and take readings at full charge.


Below is some info on Voltage vs. SOC of Li-Ion 18650 cell from other forum:
SilverFox
Li-Ion State of Charge and Voltage Measurements

There has been a lot of discussion on how to figure out the state of charge on Li-Ion cells by measuring their resting voltage.

I picked up some information on high current draws that gives the following values:

4.2V – 100%
4.1V – 87%
4.0V – 75%
3.9V – 55%
3.8V – 30%
3.5V – 0%

Please note that resting voltage means the cell has stabilized at room temperature and the voltage has also stabilized.

I decided to check a brand new 18650 cell at a defined current draw. This cell is a Pila 600P rated at 2200 mAh. The test current was 2 amps with a low voltage cut off of 2.8 volts.

At a 2 amp current draw, this is what I observed:

4.20 volts – 100%
3.97 volts – 80%
3.85 volts – 60%
3.77 volts – 40%
3.72 volts – 20%
3.58 volts – 0%

This cell tested at 2000 mAh capacity at 2 amps. I ran 2 amps for 400 mAh, then stopped the test to let the cell and voltage stabilize. I then continued to do this 5 times to come up with the values listed.
 
#37 · (Edited)
Some interesting EV battery info

Yesterday, an opportunity presented itself to take measurements of the Ionic battery in turtle mode (4 miles range left) and then fully charged. Also, the good news that it delivered all reported 137 miles after last charge to 96%(Display). It also demonstrated the outstanding experience while handling low battery conditions all the way to 4 miles, including the turtle mode when remaining range flipped from 5 to 4 miles left without any hint of panic or freakiness (--- fits on Leaf), as it simply re-mapped accelerator sensitivity to reduce the risk of power surges that could trigger voltage drop below safety thresholds. That is my friends very, very rare occurrence in EV world. And, it is not incidental as later data capture suggested the reasons for this graceful handling.

I own home charger JuceBox 40 Pro and it is smart enough to figure out exact amount of charge delivered to the vehicle battery during charging sessions with nice graphing and time info (it knows its own efficiency and specific vehicle charger efficiency). The fact it is a pro version worked in my advantage as it stopped charging once it delivered 28kWh. This offered yet another opportunity to capture the battery state at 91.5%(BMS)/96%(Display) SOC. Later I have edited charger vehicle info and increased total capacity to 30kWh, so charger delivered more to 95%(BMS)/100%(Display) SOC. It will help with approximations later.

I took screen captures from JuceBox app. It is interesting to compare it to Leaf 24kWh.

Let's start with pictures first:

1. Leaf 15 SV 24 kWh:

Image

Notice how long is the final 10% it takes and how erratic charging current becomes (fuzzy graph) and then 3 distinctive pops most likely attributed to active balancing attempts during charging.


2. Ionic phase 1 - 91.5%(BMS)/96%(Display) SOC

Image


3. Ionic phase 2 - 95%(BMS)/100%(Display) SOC

Image

Notice how quick is the finishing taper - most likely no active balancing takes place as it is rather quick and very steady current steps all the way to end of charging. Presence of those steps indicates the fact - it is enforced by the charger, not by battery getting close to full. This again suggests the battery capacity is bigger vs. disclosed figures. Probably by large number that one might guess. We can also compare to initial Leaf current tapper suggesting it is indeed battery induced (pattern close to analog noise, not well defined steps). Leaf' 8-10% top buffer would put usable capacity to 21.6-21.8kWh (observable/confirmed by many owners) out of 24kWh battery.

Also you might noticed the total charge delivered to the battery was 28+1.3 = 29.3 kWh. With an additional 4.5%(Display) SOC remaining - it would put total usable Ionic EV battery capacity to: 29.3+1.26 = 30.58 kWh. And this is below freezing temperatures. During summer it would most likely get over 31kWh usable capacity. So at this point we could settle on conclusion Ionic EV has 31 kWh usable for driving.

The remaining question is what is real battery capacity. The only reason we might want to know is to assess the durability of those usable figures over time. More excess capacity the better chances of not experiencing usable capacity degradation in the future.

I will continue later when I finished massaging the captured data, hopefully leading to a closer estimate of the real capacity of Ionic EV battery.

...
 
#39 ·
Just publishing raw figures obtained at turtle and following with 100% charge:

Turtle:
Battery Voltage: 320.7V
Average Cell Voltage: 3.341V
SOC BMS/Display: 5.5%/4.5%

Charge +28kWh:
Battery Voltage: 392.6V
Average Cell Voltage: 4.09V
SOC BMS/Display: 91.5%/96%

Charge +1.3kWh:
Battery Voltage: 396.8V
Average Cell Voltage: 4.133V
SOC BMS/Display: 95%/100%


Feel free to interpret those figures. I will get back to it a bit later.
 
#44 · (Edited)
If we assume the linear BMS SOC between 91-100% and 4.2V highest voltage of Li-ion cell for quick estimate, we would arrive to the following conclusion:

1. BMS SOC accuracy?
4.133V - 4.09V = 0.043V = 3.5%, SOC = 1.3kWh => 0.0123V = 1% = 0.3714kWh
4.2V - 4.133V = 0.067V => 5.4% SOC => proves BMS SOC is accurate at the top.

2. What is total battery capacity?
The problem is we still do not know what is the total capacity of the battery is. It is clear though that BMS SOC is
accurate.

a. (1.3kWh) We could derive total capacity from the the fact 1% of capacity = 0.3714kWh. So total
capacity should be around: 37.14 kWh. Hm, there was some leaked info about 202? Ionic EV would have
38.5kWh. Is it possible they just were referring to the real capacity of the current EV battery?

b. (28kWh) 86% = 28kWh => would arrive at 32.56kWh.

3. Safety buffers?
The safe buffer is 5% at the top and not sure about bottom buffer, the 3.341V @ 5.5% BMS SOC is also strange
as it is a bit too low for Li-Ion cell in general.

All I know the nominal usable is ~32kWh at low temp. I have to wait till summer to figure it a bit better (I am expecting it to grow to 34kWh at 80F).

Interesting the fact at high SOC Display is more optimistic and at low SOC it flips around and becomes more pessimistic.